DeviceMonitor
Android telemetry for heavy jobs

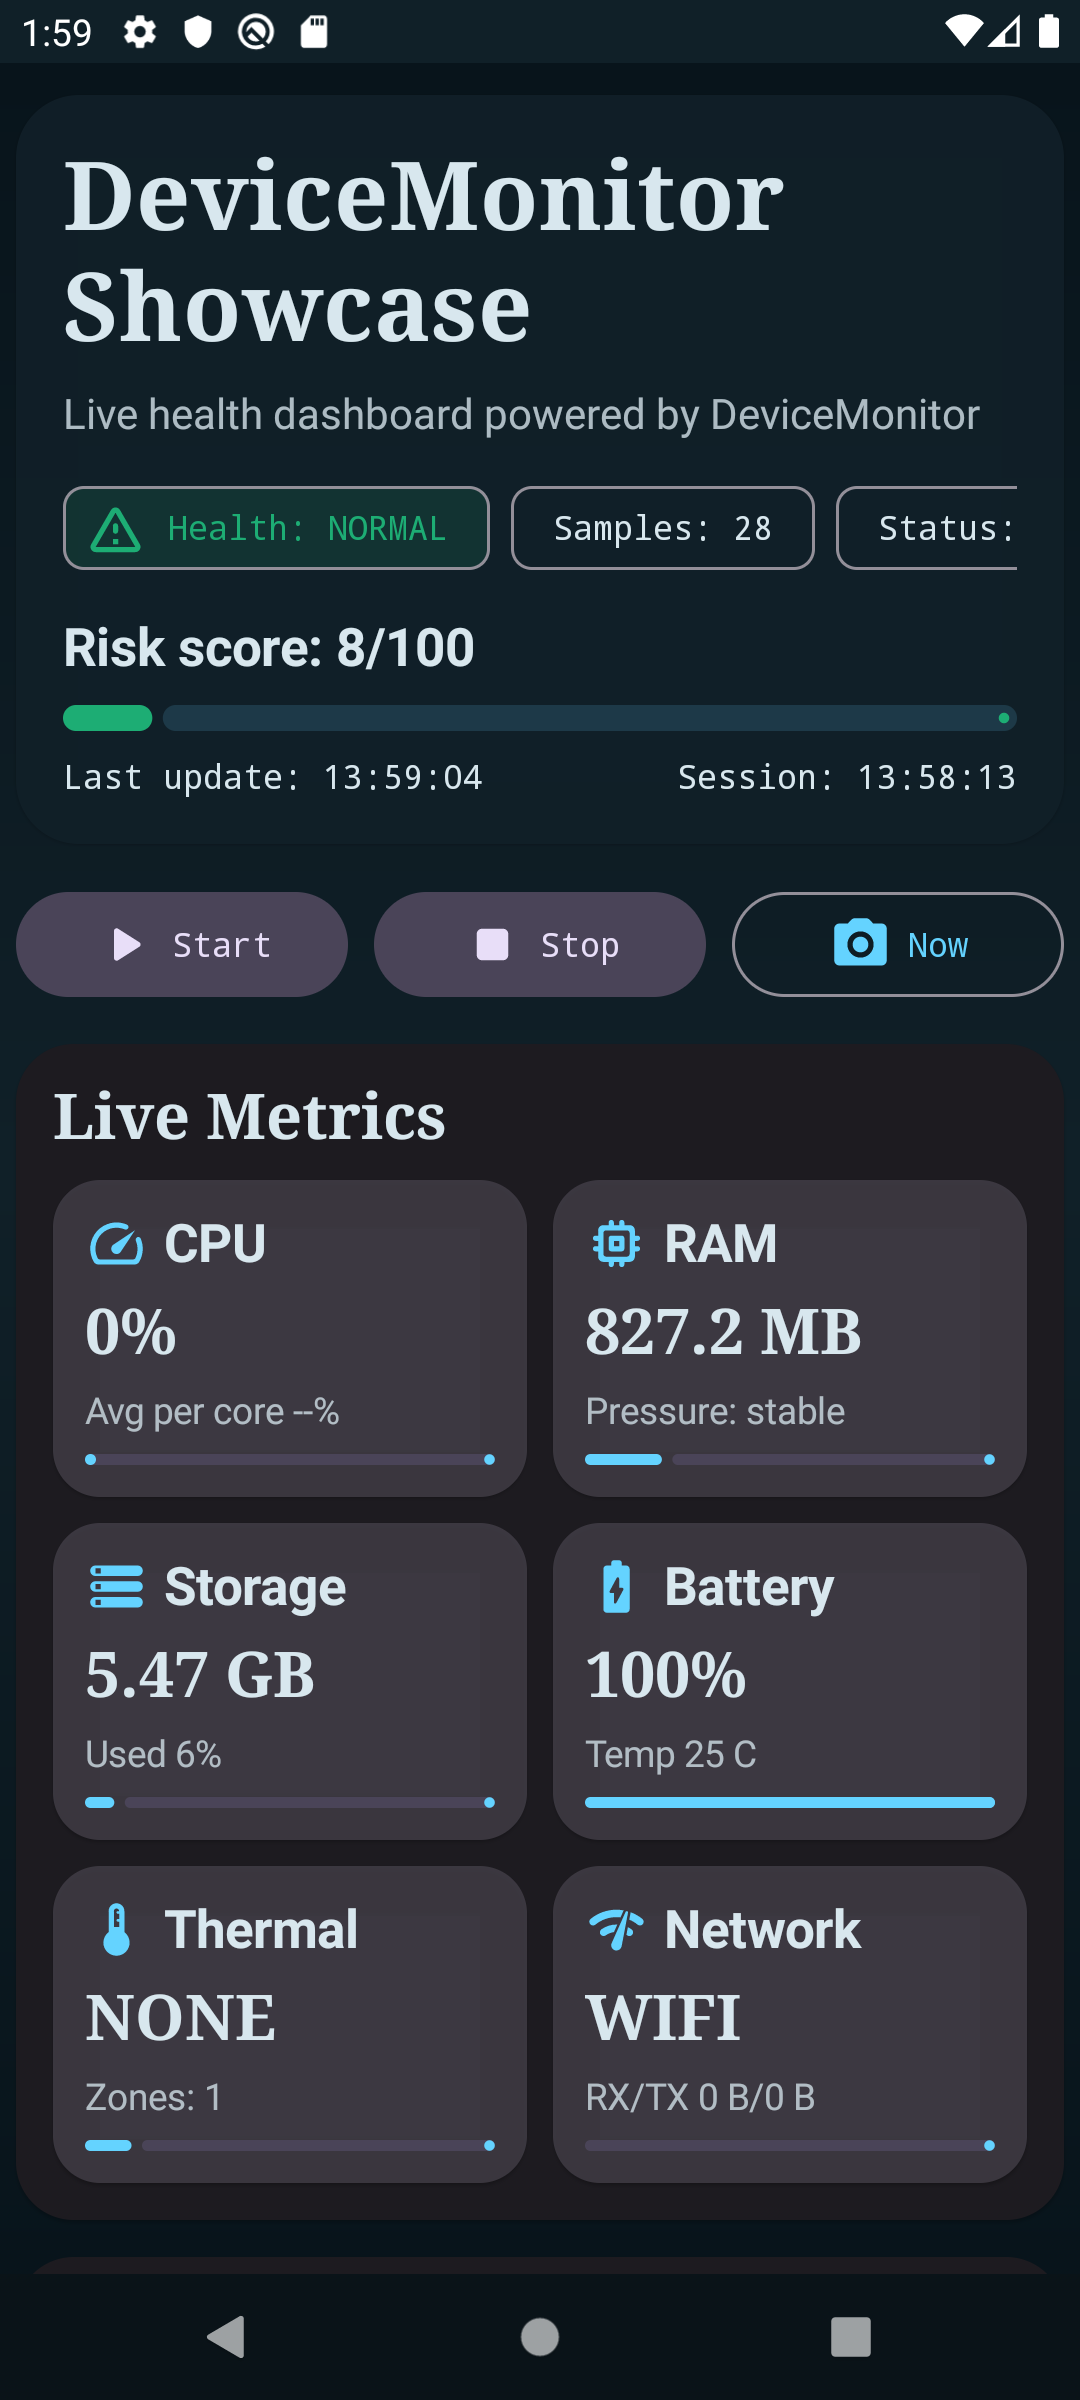
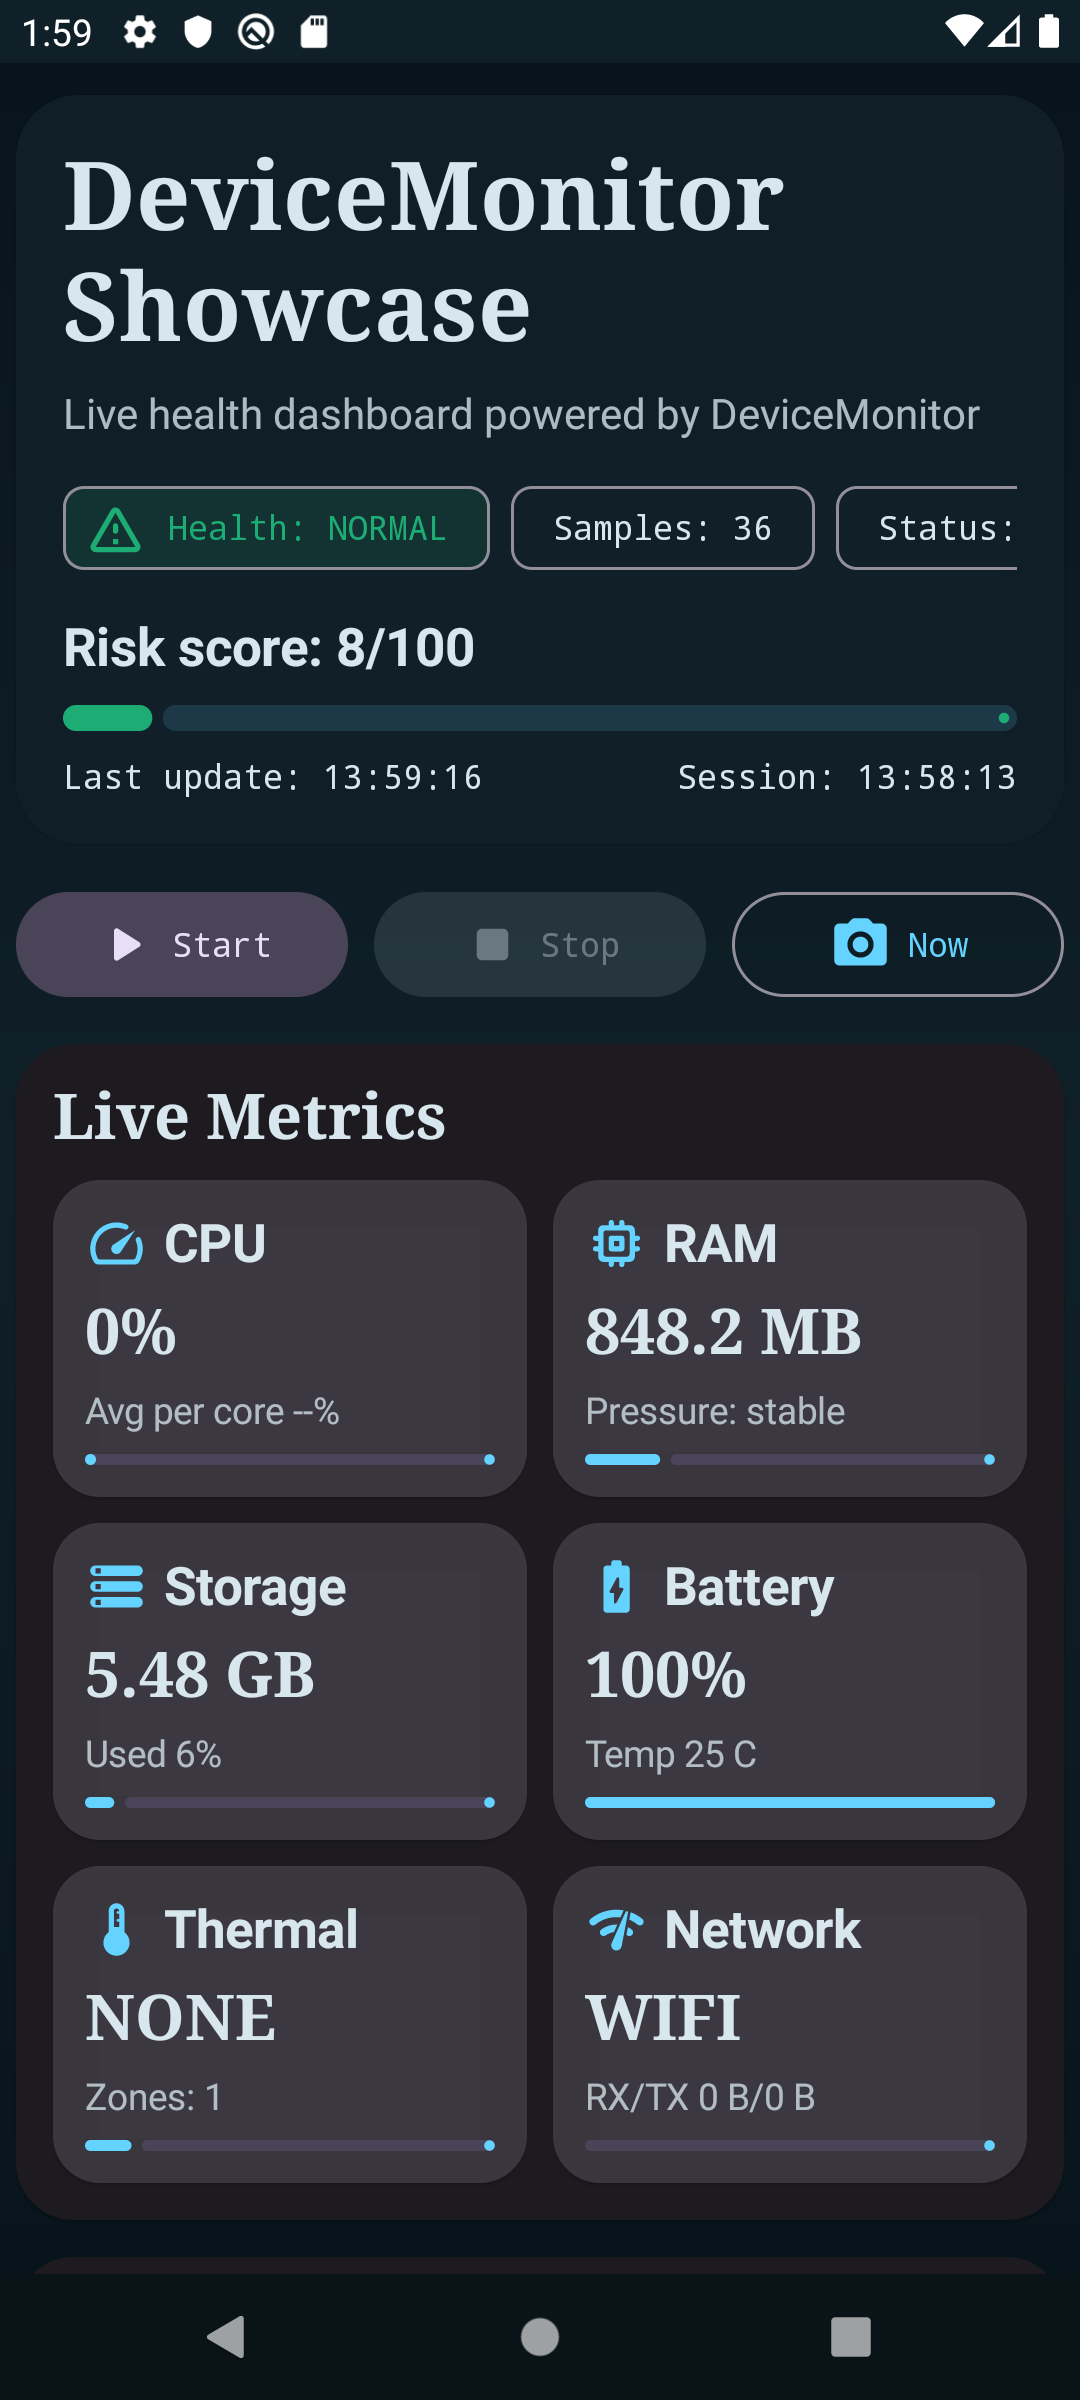
Watch device health while your app does real work.

DeviceMonitor is a lightweight Android library that emits live snapshots and warning events. It is built for exports, archive generation, media processing, and any long-running workload where thermal, memory, and battery behavior matters.

SharedFlow streams Snapshots + warning events in real time
minSdk 26 FrameMetrics hook on Android N and newer
Risk scoring riskScore() and health() in snapshot model

Core metrics

CPU, memory, storage, battery, thermal status, charging state, and network type from one API surface.

Extended telemetry

Thermal zones, network traffic deltas, battery power details, and FrameMetrics snapshots when attached to a window.

Runtime control

Adjust thresholds and sample period through DeviceMonitorConfig with builder-style setup.

Event stream

Subscribe once and react to risk transitions with typed warning events instead of custom polling logic.

Install from Maven Central

Current project version in repository config is 0.3.0.

dependencies {
    implementation("io.github.0dimidrol0:DeviceMonitor:0.3.0")
}
Artifact io.github.0dimidrol0:DeviceMonitor
Minimum SDK 26
Default sample period 15_000 ms

What you get in snapshots

  • CPU usage and per-core usage
  • CPU frequencies
  • Available RAM and low-memory flag
  • Free and total storage
  • Battery level and temperature
  • Charging state and plug type
  • Battery voltage and health
  • Thermal status and thermal zones
  • Network type and traffic deltas
  • Frame duration and jank percent
  • Uptime and derived storage usage
  • Built-in risk score and health bucket

Config in practice

Enable what you need and tune limits for workload-specific behavior.

DeviceMonitor.init(
    applicationContext,
    DeviceMonitorConfig.builder()
        .samplePeriodMs(1_500L)
        .memoryThresholdMb(512L)
        .storageThresholdMb(1_536L)
        .cpuOverloadThresholdPercent(85f)
        .batteryLowThresholdPercent(20)
        .batteryTemperatureThresholdC(44f)
        .build()
)

You can also update thresholds dynamically with DeviceMonitor.setMemoryLowThreshold(...) and DeviceMonitor.setStorageLowThreshold(...).

Warning events

Typed warnings from SharedFlow<DeviceWarningEvent>:

ThermalChanged(from, to)
MemoryLow(availBytes, thresholdBytes)
StorageLow(freeBytes, thresholdBytes)
BatteryLow(levelPercent, thresholdPercent)
BatteryTemperatureHigh(temperatureC, thresholdC)
CpuOverload(usagePercent, thresholdPercent, coreCount)

Where it shines

Data export, archive generation, media processing, long background jobs, and CPU-heavy workflows.

Serialization ready

thermalZones and networkTraffic are straightforward to send to backend logging pipelines.

Frame metrics hook

Attach with registerFrameMetrics(window) and detach with unregisterFrameMetrics().

Showcase app in this repository

The :app module demonstrates live dashboard rendering, warning timeline, and instant snapshot actions.

DeviceMonitor showcase main dashboard
Main dashboard
DeviceMonitor showcase live metrics
Live metrics state